


Suite à la dissolution de l’Assemblée Nationale par le Président de la République le 9 juin dernier, les élections législatives auront lieu le 30 juin 2024 (1er tour) et le 7 juillet 2024 (2nd tour).
BUREAUX DE VOTE
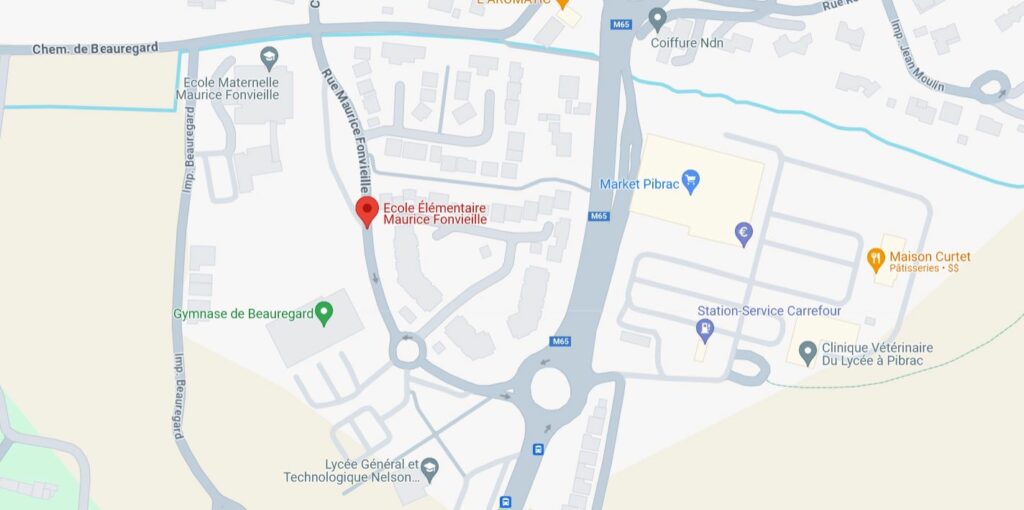
Depuis les élections européennes du 9 juin 2024, tous les bureaux de vote sont centralisés à la nouvelle école élémentaire Maurice Fonvieille (rue Maurice Fonvieille).
HORAIRES :
De 8h à 18h.
INSCRIPTION SUR LES LISTES ÉLECTORALES
La préfecture de la Haute-Garonne vous informe que « Les listes électorales qui seront utilisées pour l’élection sont celles arrêtées à la date du 9 juin 2024 (date de dossier complet dans le REU dans le cas d’une nouvelle inscription). Toutes les inscriptions qui interviendraient après cette date ne pourront être prises en compte pour la participation au scrutin des 30 juin et 7 juillet prochain. »
Toutefois, vous pouvez voter ou donner procuration dans votre précédente commune, avant votre arrivée sur Pibrac.
PROCURATION
Privilégiez la procuration en ligne via sur www.maprocuration.gouv.fr :
L’électeur doit obligatoirement posséder une identité numérique certifiée, obtenue après un déplacement dans une Mairie volontaire.
Toutes les étapes et informations sur la procuration en ligne sur www.maprocuration.gouv.fr
La validité de votre procuration en ligne doit vous être confirmée par le site « Maprocuration » via l’intitulé « Votre procuration a été validée ».
Si vous n’êtes plus certain d’avoir donné procuration ou si vous souhaitez savoir si votre procuration est toujours valable, vous pouvez utiliser le téléservice « Interroger sa situation électorale. »
Il suffit de renseigner la commune dans laquelle vous êtes inscrit, votre nom et prénom(s), votre sexe et votre date de naissance. Le téléservice vous indiquera alors à qui vous avez donné procuration et si vous êtes, vous-même, détenteur d’une procuration.
Procuration physique :
Pour les électeurs ne possédant pas d’identité numérique certifiée, ces derniers doivent toujours se déplacer en commissariat ou en brigade de gendarmerie, pour faire établir une procuration. Seuls les commissariats, gendarmeries et consulats sont habilités à valider l’identité et non pas la police municipale.
Pour rappel,vous pouvez donner procuration à tout moment jusqu’à la date du scrutin du premier tour. Cependant, en cas de demande tardive, compte tenu des délais d’acheminement et de prise en compte par la Mairie de votre procuration, il est possible que votre mandataire ne puisse pas voter à votre place.
De ce fait, il est préférable que l’enregistrement de votre procuration auprès des services compétents soit réalisé le vendredi 5 juillet 2024 au plus tard.
Tout savoir sur les élections législatives : www.elections.interieur.gouv.fr/scrutins/elections-legislatives